

Google's AI Overviews have been live in France since July 22.
Four weeks have passed, la rentrée is just around the corner, and we figured it was worth taking a first look at the impact before September arrives.
A month seems a bit short to draw definitive conclusions, but it's enough to spot the first shifts in the metrics. Before we start, a quick reminder for those who were away all summer:
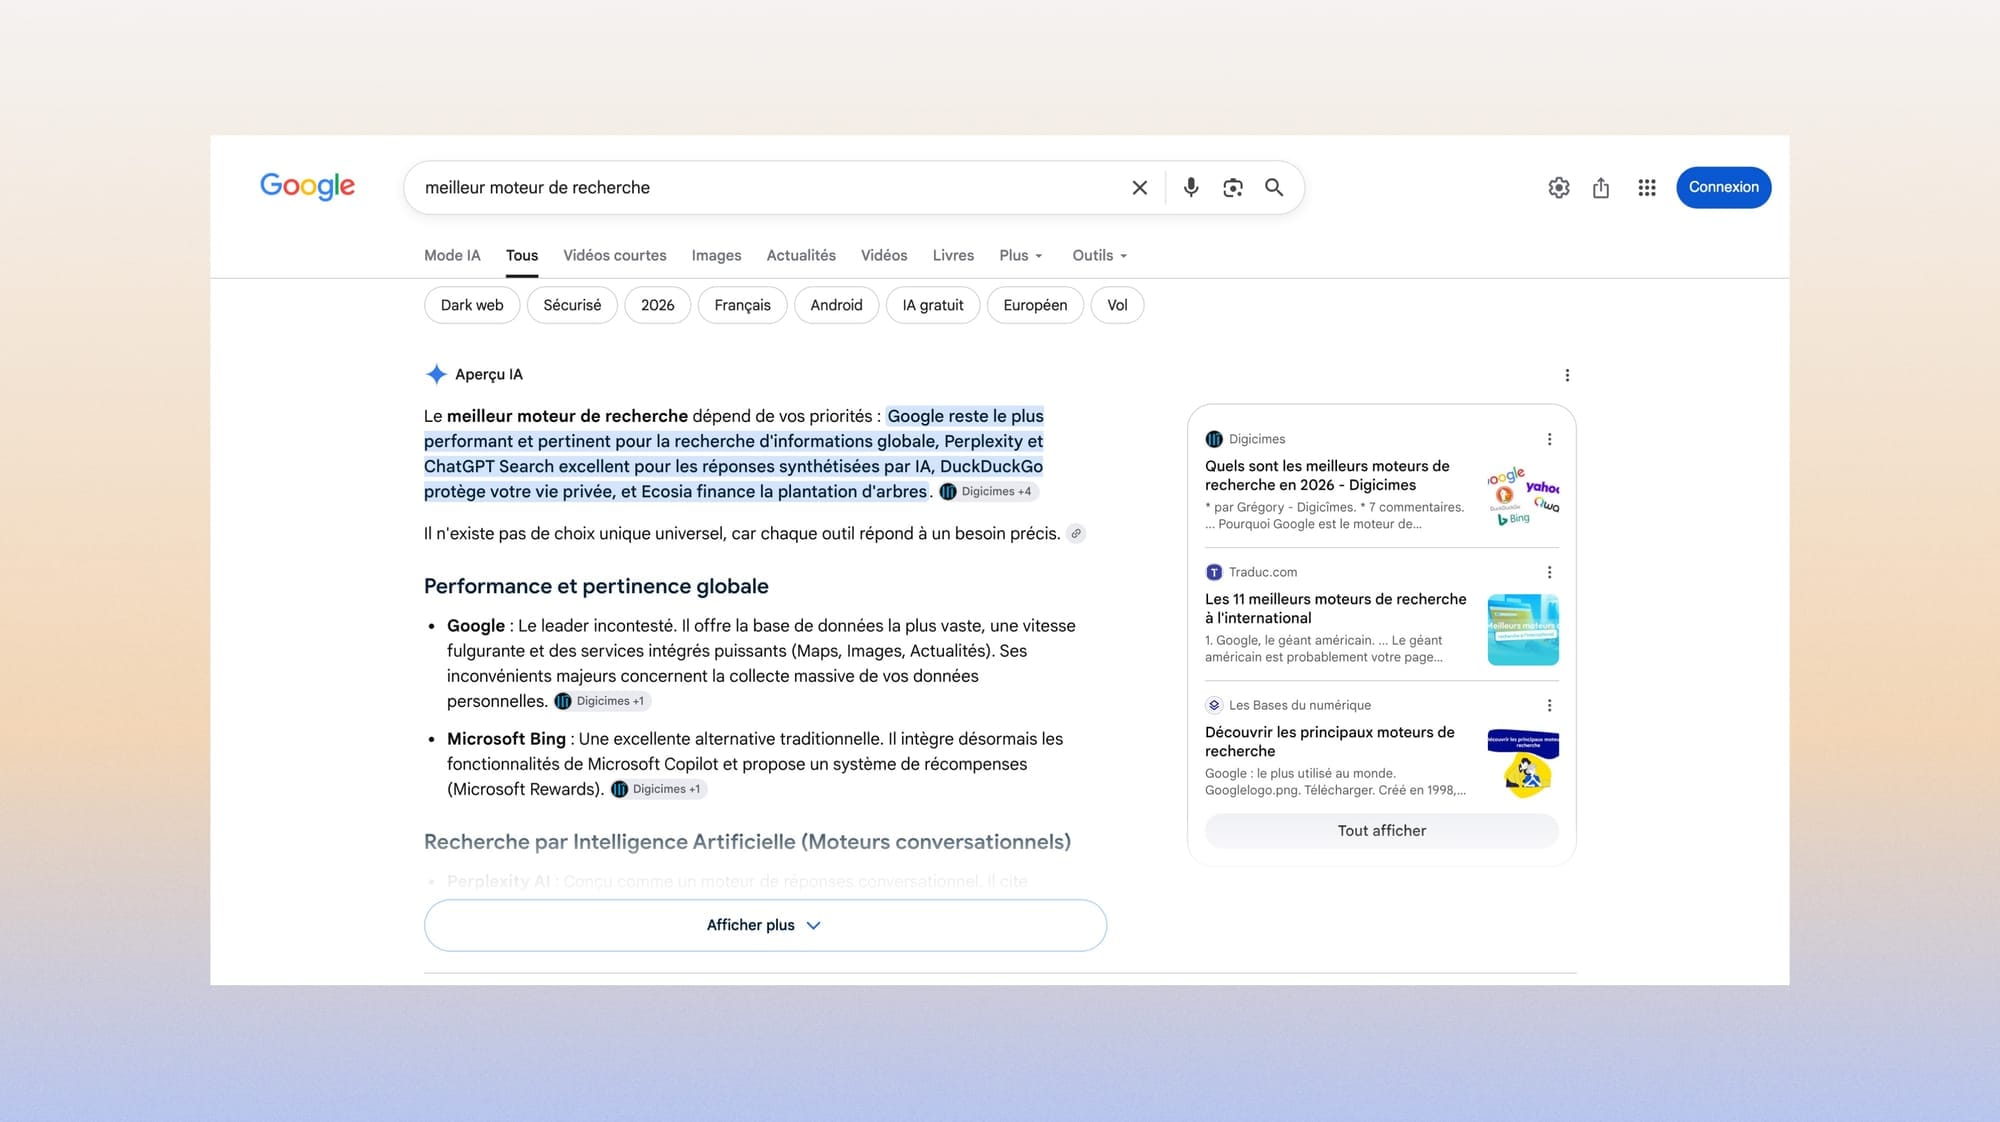
This summer, Google updated its documentation on optimizing for generative features. It states that these surfaces rely on the same ranking and quality systems as classic search, with two mechanisms added on top: retrieval-augmented generation, which pulls from the index the pages that anchor the answer, and query fan-out, which splits one question into several simultaneous queries to cover what the person didn't spell out.
So what feeds the summary is, for the most part, what is already indexed and ranking.
OK, so nothing new under the sun? Not quite.
To grasp how big the impact is, the press is still the easiest case to read, because its business model rests entirely on the click.
On August 11, the Alliance de la presse d'information générale, which represents more than 300 titles, filed a complaint with the Autorité de la concurrence, accusing Google of rolling out the feature without prior negotiation.
When an audience is monetized by impressions, a summary that answers in place of the article means lost revenue from the first month. Hence the urgency of the complaint.
An e-commerce store lives off something else, but its acquisition is affected too, and that's where the analysis gets interesting, because the first serious commercial data arrived at about the same time as the complaint.
What the data tells us so far
On August 11, Shopify published its second-quarter readout across all its stores. For now, it's the best available basis on buying behavior from AI interfaces.
One caution before diving in: this quarter runs from April to June, so it falls entirely before the French rollout, and it aggregates markets where AI Overviews have been running for two years. So these figures tell us what to look at in our own end-of-August reports, and help us keep the critical distance that stops us from panicking when a curve moves. They don't predict what France will show.
AI-referred sessions are up 197% year over year, with orders growing at a similar rate. Meanwhile, organic search grows 12% on a much larger base and still sends more sessions on its own than all tracked AI platforms combined.
Both surfaces are growing at the same time, which means we can set aside the idea of substitution and think instead in terms of how usage is split.

The finding builds on a first readout published in May on the first quarter, in which sessions from chatbots were already up more than eightfold year over year and orders nearly thirteenfold. Two quarters pointing the same way is starting to look like a habit.
A person who arrives from an AI on a product page converts about 80% better than a person who arrives from organic.
The gap reaches a factor of two in categories where the decision hinges on specs, compatibility, or a specific use.
The breakdown by subcategory illustrates these numbers well: apparel converts 1.6 times better on average from AI, watches rise to 2.4, and necklaces to 2.3. The dividing line has less to do with the sector than with how many checks someone has to make before buying.
Where taste alone decides, the contribution shifts to acquisition, with 1.3 times more new customers than from organic. AI then helps people discover brands they wouldn't have come across otherwise.
Behind these gaps lies a single cause that Shopify calls "journey compression": half of AI-referred sessions land directly on a product page.

The point of comparison is often missing when this figure gets repeated elsewhere: on the organic side, the share of sessions that start on a product page is around 20%.
The first-quarter readout added something that speaks to finance teams: an average order value 14% higher on orders from an AI, and a conversion advantage verified in 23 of 25 merchandise categories.
Discovery and comparison happened elsewhere, in a conversation. What reaches your site is someone who has already narrowed things down and comes to verify.
So the high conversion rate describes a population, not just a performance.
What's hard to read for now
Traffic from AI Overviews is most often counted as organic search in analytics tools.
So the AI figure you see in your reports is structurally underestimated
The organic line now holds two very different populations: people who clicked a classic link after scanning the results page, and people who arrive after reading a summary and sometimes asking a couple of follow-up questions.
A rise can signal a richer mix, a drop can signal the opposite, and in both cases the action to take is completely different.
The useful reflex is to isolate what can be isolated. Start with identifiable referrers from conversational platforms. Then open the performance report dedicated to generative features that Google added to Search Console and now presents as the only reliable source on the topic, looking at the gap between impressions and clicks query by query rather than in aggregate. And accept that part of the phenomenon will stay invisible until the organic line has been broken out.
The other effect, a slower one, concerns the validity of comparisons. Reports that compare August 2026 with August 2025 will be comparing two different traffic compositions in a market that shifted mid-summer, and that kind of comparison deserves at least a footnote.
Raw material is still the first pillar of conversion
So what can we do?
When the AI relied on structured catalog data to find and recommend a product, the sessions it sent converted twice as well as those where it had worked from third-party feeds or scraped content.
The quality of your structured data and assets is still what affects your conversion rate most.
This point deserves a couple of seconds, and an attempt to see it more clearly, because the sources can seem to diverge:
- Google states in black and white that structured data doesn't determine whether you appear in its generative features. It lists the llms.txt file, chunking content into fragments, and hunting for artificial mentions among the myths.
- The measurement Shopify shared covers a different scope: platforms that consume a product catalog to recommend a specific item.
With a bit of perspective and common sense, the two agree on the substance: accurate, complete, up-to-date product data supports recommendation whichever engine reads it, and the debate is about format rather than the effort required.

A page that receives someone who has already compared three products elsewhere must first make what they were told verifiable, with exact specs, compatibility, use cases, delivery times, return policy, and reviews.
A good part of what we covered in the complete product page audit takes on new weight in this context, especially everything that's about precision rather than seduction.
Vocabulary matters too, since conversational queries are longer and closer to spoken language. That matches what we've always seen in internal search, the only place on the site where shoppers spell out their request in full.
Finally, there's a brand dimension, and it ties in with what Florian Deveaux told us about the brand that drives purchases. A summary is built by cross-referencing sources. A message delivered the same way on your site, in the press, at resellers, and in reviews produces a faithful description. A message that has changed three times in five years produces a patchwork of layers whose approximation shows.
Consistency becomes a conversion variable, with a number attached.
What to add to your to-do list before la rentrée
This week's most useful move takes half an hour: type your brand name, then three or four category queries you compete on, read the summary, note the cited sources, and compare the portrait you get with the one you defend internally.
Most teams will probably find a gap they didn't know about, often an old page that carries more weight than the homepage, or a customer review that shapes the whole perception.
This manual check hits its limits fast, once you go beyond a few queries or want to track change over time.
That's why we built our own GEO audit tool, Magellan.

It queries answer engines about your brand and your category's queries, picks up what's being said about you, where the cited sources come from, and which questions you're missing from, then turns it all into a report a marketing team can easily read.
It's free and takes a few minutes, which is still the best ratio of effort to clarity at this stage.